Getting Started
User guide in PDF-format
EndometDB_Guide.pdfUser Interface
EndometDB supports all internet enabled devices using a modern browser. It utilizes HTML5, JavaScript, PHP, and R as the main programming languages. The interactive visualization is implemented using the Plotly open source JavaScript graphing library.
When the EndometDB opens, the interface features a window divided into panes: the filter control in the left pane, and a tabbed browser in the right pane.
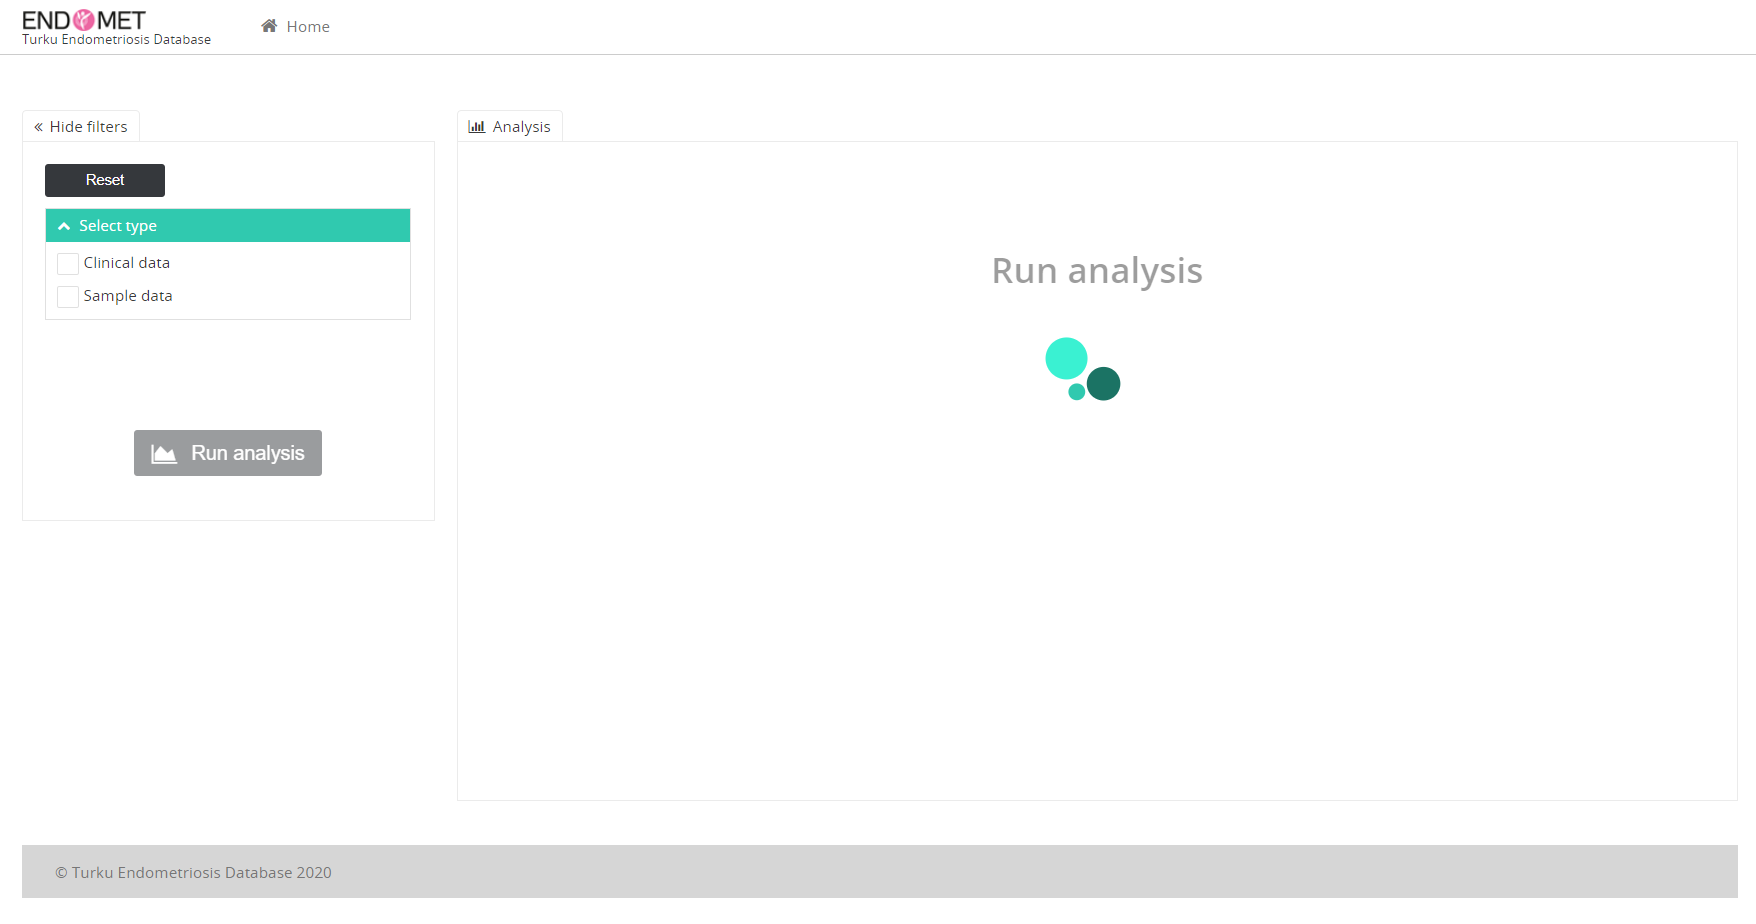
Filter Control
The left pane of the main window displays a filter control that allows users interact with the data in the EndometDB.
the nodes in the filter control can be expanded to access context menus by clicking in the check box. The filter control expands to display options that includes one or more of the following selections:
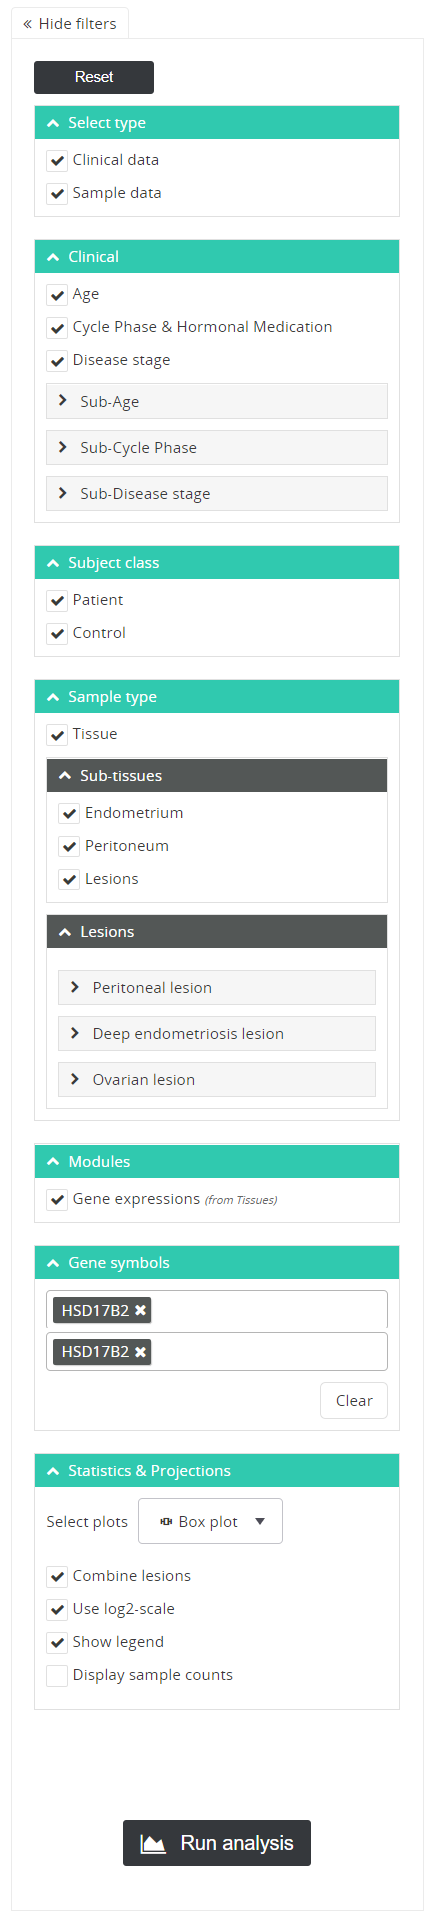
the nodes in the filter control can be expanded to access context menus by clicking in the check box. The filter control expands to display options that includes one or more of the following selections:
|
Option |
Action |
|---|---|
|
Clinical data |
Click in check box to display clinical data menus that includes data such as age, cycle phase & hormonal medication use, and disease stage. |
|
Age |
Click in check box to display age categories |
|
Cycle phase & Hormonal medication |
Click in check box to display cycle phase and hormonal medication use |
|
Disease Stage |
Click in check box to display the different stages of disease |
|
Sample data |
Click in check box to display the subject class menus |
|
Subject class |
Click in check box to display the sample type menu |
|
Sample type |
Selected by defaults displays the tissues and the lesions |
|
Tissue |
Selected by default to display the different tissue types plus the lesion |
|
Lesions |
Selected by default under tissue menu displays the different lesion types |
|
Modules |
Click in check box to display the gene symbols menu with text box to enter gene interest or copy paste genes of interest. |
|
Gene symbols |
Entering gene of interest or copy pasting genes displays Statistics & Projections menu |
|
Clear |
Clear button clears all the genes in the text box |
|
Statistics and Projections |
Select plots from drop down menu to display different functions available |
|
Run analysis |
Run analysis button executes the |
|
Reset |
Resets all to default settings |
|
Close |
Closes current browser except for the default browser |
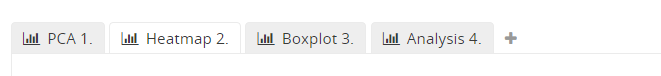
Filter Control
The right pane of the EndometDB window feature a tab browser that displays plots and projections from gene or genes of interest with different selected options in the filter control in the left window. The plus sign (+) to the right of the browser appears when an initial plot is done. Use the plus sign (+) to add more tabs.